This tutorial explains how to use CanvasJS charts in Angular js. At the end of this tutorials you can find the demo and source code for download. In this tutorial, we covered all canvasJs charts.
Let start the tutorial how to use angular js with canvasJS charts.
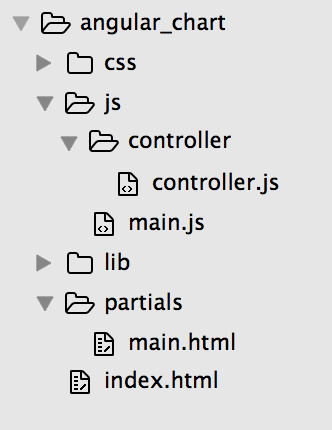
Find the folder structure of the project below.

underscore.js used for grouping and bootstrap for layout design. Find all library files under lib folder(angular, canvas, underscore) and bootstrap in css folder.
Create index.html
Copy past the below code inside index.html
<!DOCTYPE html>
<html>
<head>
    <title>iTunes Top Paid Applications</title>
    <meta charset="utf-8">
    <meta http-equiv="X-UA-Compatible" content="IE=edge,chrome=1">
    <meta name="viewport" content="width=device-width, initial-scale=1">
    <link rel="stylesheet" href="css/bootstrap.min.css">
</head>
<body ng-app="angularDemo">
<div ng-view></div>
<script src="lib/angular.min.js"></script>
<script src="lib/angular-route.min.js"></script>
<script src="lib/canvasjs.min.js"></script>
<script src="lib/underscore-min.js"></script>
<script src="js/main.js"></script>
<script src="js/controller/controller.js"></script>
</body>
</html>
Create main.html under partials.
Copy past the code inside main.html
<nav class="navbar navbar-default" role="navigation">
  <div class="navbar-header">
    <span class="navbar-brand">{{title.label}}</span>
  </div>
</nav>
<div class="container">
    <div class="col-md-2">
      <ul class="nav nav-pills nav-stacked">
        <li><a ng-click="updatePieChart('pie')">Pie</a></li>
        <li><a ng-click="updatePieChart('column')">Column</a></li>
        <li><a ng-click="updatePieChart('stackedArea')">Stacked Area</a></li>
        <li><a ng-click="updatePieChart('doughnut')">Doughnut</a></li>
        <li><a ng-click="updatePieChart('spline')">Spline</a></li>
        <li><a ng-click="updatePieChart('bubble')">Bubble</a></li>
      </ul>
    </div>
    <div class="col-md-10">
        <!-- Render the pie chart over here -->
        <div id="chart" style="height: 250px; margin: 0 auto"></div>
    </div>
    <div class="clearfix visible-lg"></div>
</div>
Create main.js under js folder.
Open main.js file and copy past the below code
var app = angular.module('angularDemo', [
  'ngRoute'
]);

app.config(['$routeProvider', function ($routeProvider) {
  $routeProvider
    // Home
    .when("/", {templateUrl: "partials/main.html", controller: "iTunesAppCtrl"})
    // else Home
    .otherwise("/", {templateUrl: "partials/main.html", controller: "iTunesAppCtrl"});
}]);
Create controller.js under js->controller folder
Copy past the below code. Here for data I have used the “iTune top paid app” free api services.
app.controller('iTunesAppCtrl', function($scope,$http,$filter) {
  $http.get('https://itunes.apple.com/us/rss/toppaidapplications/limit=100/json').
    success(function(data) {
        // Store App data in App object
        $scope.app = data.feed;

        // Parse iTunes App Data and store it in items object
        $scope.items = $scope.parseData($scope.app.entry);

        // Set page title
        $scope.title = data.feed.title;

        // Group the data using price and map to chartData object
        $scope.chartData = $scope.groupAppData();

        // Update the chart when ever there is a change in chartData
        $scope.chart.options.data[0].dataPoints = $scope.chartData;
        $scope.chart.render();
    });

    // Parse data function
    $scope.parseData = function(data){
      var parsedAppData = [];
      if(!angular.isUndefined(data)){
        angular.forEach(data, function(value, key) {
          parsedAppData.push({
              price: value['im:price'].attributes.amount,
              priceLabel: value['im:price'].label,
              name: value['im:name'].label,
              image: value['im:image'][0].label,
              category : value.category.attributes.label
          });
        });
      }
      return parsedAppData;
    };

    // Update chart function
    $scope.updatePieChart = function(chartType){
        $scope.chart.options.data[0].type = chartType;
        $scope.chart.render();
    };

    // Group app data
    $scope.groupAppData = function(){
      var groupedChartData = [];

      angular.forEach(_.groupBy($scope.items, 'price'), function(value, key) {
        groupedChartData.push({
            y: value.length,
            label: key
        });
      });
      return groupedChartData;
    };

    // Create pie chart and keep it DOM
    $scope.chart = new CanvasJS.Chart("chart", {
        title:{
            text: ""
        },
        axisY: {
            labelFontSize: 16,
        },
        axisX: {
            labelFontSize: 16,
        },
        data: [
            {
                type: "pie",
                dataPoints: []
            }
        ]
    });
});
Leave a Reply